The tariff structure implemented by Eskom on April 1, 2025, has left electricity users uncertain about the resulting financial implications. Talk of new Generation Capacity Charge and Legacy Charge left our farmers with many questions, especially when articles claim that organisations with solar plants will be taxed higher. This article will explain what the Ruraflex tariff structure looks like, and how this will influence you.
Eskom’s Ruraflex Tariffs for Grid-Tied Renewable Energy Systems.
Grid-tied renewable energy systems allow customers to generate their own electricity from sources like solar panels while remaining connected to the national grid. Eskom requires customers with such systems to utilise a Time-of-Use tariff.
For those currently on a rural tariff structure (Ruraflex, Landrate, or Nightsave), this requires a switch to the Ruraflex Gen tariff. The Ruraflex Gen tariff has the exact same cost structure for the customer as the standard Ruraflex tariff; the only difference is that Ruraflex Gen additionally permits on-site generation and the export of surplus energy back to the grid.
The remainder of this article will focus on the Ruraflex tariff structure, and the changes that have been brought to it.
What does the Ruraflex Tariff structure consist of and what has changed?
The Ruraflex tariff structure can be broken into three main categories, namely Energy Charges, Network Charges and Administration/Service Charges.
Energy Charges
The first and often the largest charge on an Eskom account are Energy Charges. This includes the Active Energy Charge, as well as the new Generation Capacity Charge and Legacy Charge.
The Active Energy Charge is based on the amount of electricity used (in kWh or “units”), with rates that vary based on “Time-of-Use” (peak, standard and off-peak times) and the season of use (high demand or low demand).
Changes:
- The time periods have changed: The Morning Peak (also known as red time) has decreased from three to two hours, while the evening peak has increased from two to three hours. Additionally, there is now a new standard period on a Sunday.
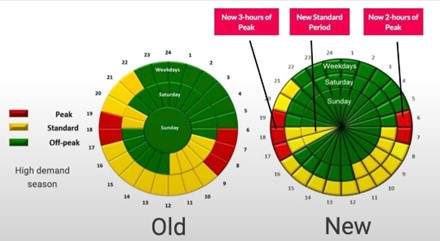 Figure 1: Time-of-Use periods
- Change in prices of all Time-of-Use periods, as indicated in figure two below.
- – In the High demand season (June to August), customers will see a 9% increase in peak times, 11% decrease in standard times, and a 10% increase in off-peak times.
- – In the Low demand season (September to May), customers will see a 38% increase in peak times, 13% increase in standard times, and a 27% increase in off-peak times.
Eskom has stated that the difference between the most expensive electricity (peak times) and the cheapest electricity (off-peak times) is getting smaller. In the past, peak power could be eight times more expensive than the cheapest off-peak power. Now, it’s closer to six times more expensive.But here’s the main reason why that gap is shrinking: the cost of electricity during the traditionally cheapest off-peak periods (in the low-demand season) is going up quite a bit. In fact, these off-peak rates will now be the same as the off-peak rates you pay during the more expensive high-demand season. So, while the difference looks smaller, it’s largely because the cheapest electricity is getting more expensive.
The bar chart below visually represents these Time-of-Use tariff changes, comparing the 2024 and 2025 rates for Peak, Standard, and Off-peak periods during both High and Low demand seasons.
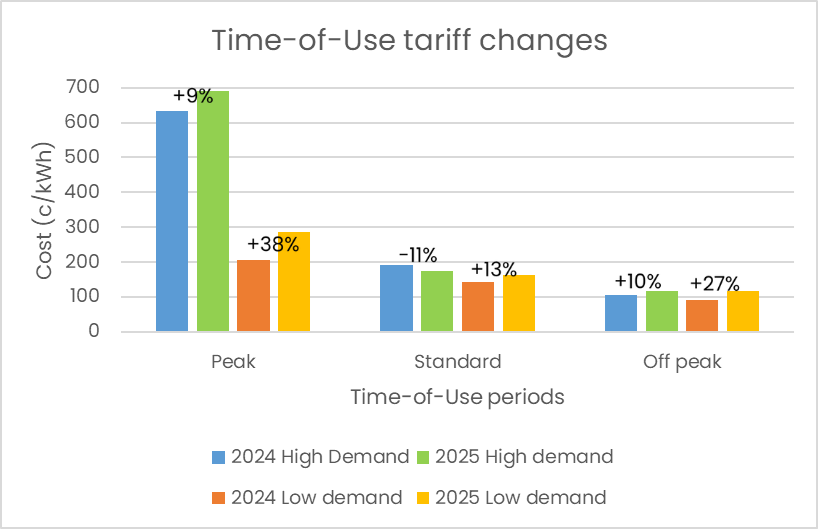
Figure 2: Comparison of Eskom’s Time-of-Use Tariffs for 2024 and 2025
Eskom introduced the new Generation Capacity Charge (GCC) and Legacy Charge as part of an unbundling of existing energy charges, aiming to improve transparency and recover costs associated with the renewable energy transition.
Eskom has observed that more customers with embedded generation (such as solar PV) remain connected to the grid but use very little electricity, effectively treating the grid as a backup. This results in low energy charges that do not cover Eskom’s fixed costs to maintain the network. Eskom argues that this creates an “unintentional subsidy,” where customers without renewable systems unfairly carry more of the cost burden.
To address this, the GCC and Legacy Charge have been created, ensuring all customers contribute more equitably to grid infrastructure and maintenance, regardless of energy consumption. Here is everything you should know about it:
- The GCC is calculated as a R/kVA, determined by your Utilised Capacity as displayed on your Eskom bill. Utilised capacity is the highest amount of electricity that a customer used at any one time during the month.
- – The original charge submitted by Eskom was considered too high according to NERSA, so this will be phased in, starting with 20% in 2025/26, 30% in 2026/27, and to be determined after.
- – This charge will be seen on all tariff structures.
- The Legacy Charge is calculated as a c/kWh, determined by the total kWh used each month.
- – This charge will only be seen on the Ruraflex tariff structure.
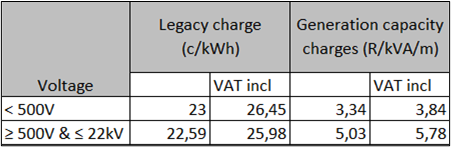 Figure 3: Generation Capacity Charge (GCC) and Legacy Charge tariffs
Chris Yelland explains in an interview that the effect of these charges, will be that customers who use little energy (typically customers with their own energy system, only using Eskom as a backup) will experience a higher percentage price increase for energy charges on their Eskom bills. This is because the increase in fixed costs will make up a bigger percentage of their total bill, while the impact of increase in actual energy costs will be minor.
Network Charges
The second category of charges are the network charges. The purpose of these charges are to cover the cost of using Eskom’s infrastructure (like power lines and transformers). It consists of a Network Capacity Charge and a Network Demand Charge.
The Network Capacity Charge is a fixed R/KVA charge based on the maximum capacity (kVA) allocated to the customer, as displayed under Utilised Capacity on the Eskom bill.
- – Changes: There will be an increase of 43% on this fixed cost.
The Network Demand Charge is a variable c/kWh charge based on the total measured demand (kWh) over all time-of-use periods— this reflects the strain placed on the network.
- – Changes: Decrease of 7.5% on this variable charge.
Administration/Service Charges
The final category consists of Administration Charges and Service Charges, all of which are fixed costs calculated per Point of Delivery. Each of these charges cover the fixed costs of services provided by Eskom.
The Service Charge is for the basic provision of electricity services, including metering and maintenance.
- – Changes: There will be a significant decrease in costs, as can be seen in the table below.
The Ancillary Service Charge covers the cost of grid stability services like frequency regulation, voltage support, and reserves required to maintain reliable supply.
- – Changes: Decrease of 49% on this variable charge.
The Administration Charge covers the cost of billing, account management, and customer service operations.
- – Changes: There is a significant decrease in administration charges, as can be seen in the table below.
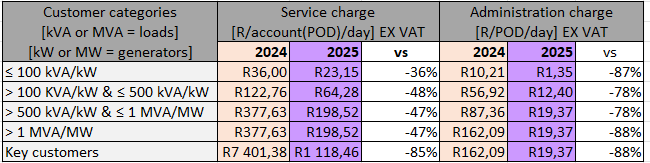 Figure 4: Service Charge and Administration Charge tariffs
If you would like to view the Eskom tariff structures in further detail, you can download the excel sheets here:
- – 2024/25 Tariff structures: https://www.eskom.co.za/distribution/2024-2025-tariff-increase/
- – 2025/26 Tariff structures: https://www.eskom.co.za/distribution/2025-2026-price-increase/
We have used the tools available above to create a case study comparing electricity costs for a farm with and without a renewable energy system.
Case study of costs
The case study is based on one of our Ruraflex clients. They have a heavy load during low demand season, with highest demand from January to April. They have a supply size between 100KVA and 500kVA, supply voltage of 500V, 200NMD, and 0-300km transmission zone.
Case study 1: Farm without a renewable energy system
Without a renewable energy system, the client requires more accounts, or with the new tariff structure, this equates to having more points-of-delivery.
In this case study, the client has 9 Points-of-Delivery. Their energy consumption (in kWh) per month is as follows:
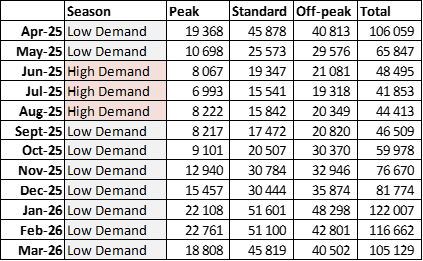 Figure 5: Energy use for farm without renewable energy system for a year
Outcome: Annual price increase of 23.33% on electricity bills for 2025/26.
- High demand season (June-August): total increase of 11.3%
- Network charges: increase of 4.5%, contributing 18.82% of total bill.
- Energy charges: increase of 14%, contributing 68.67% of total bill.
- – GCC makes up 0.57% of energy charges.
- – Legacy charge makes up 8.81% of energy charges.
- Other charges (service and admin, etc.): increase of 7.63% contributing 12.51% of total bill.
- Low demand season (September-May): total increase of 26.62%
- Network charges: decrease of 0.35% contributing 22.07% of total bill.
- Energy charges: increase of 42.42%, contributing 68.95% of total bill.
- – GCC makes up 0.41% of energy charges.
- – Legacy charge makes up 12.21% of energy charges.
- Other charges (service and admin, etc): increase 6.68%, contributing 8.98% of total bill.
Case study 2: Farm with renewable energy system
Due to our renewable energy system, we were able to cut 8 of the points-of-delivery from the previous system, leaving only one point as a back-up to the grid. This means fixed costs are only applied to one point-of-delivery.
The energy consumption (in kWh) per month from the grid is as follows:
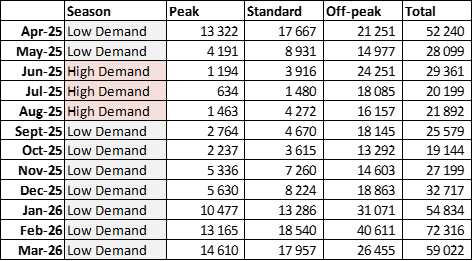 Figure 6: Energy use from the grid for farm with renewable energy system for a year
Outcome: Annual price increase of 23.50% on electricity bills for 2025/26.
- High demand season (June – August): total increase of 12.57%
- Network charges: increase of 11.83%, contributing 33.81% of total bill.
- Energy charges: increase of 24.88%, contributing 62.53% of total bill.
- – GCC makes up 1.7% of energy charges.
- – Legacy charge makes up 13.11% of energy charges.
- Other charges (service and admin, etc.): decrease of 57.04% contributing 3.66% of total bill.
- Low demand season (September – May): total increase of 25.98%
- Network charges: increase of 6.06%, contributing 28.30% of total bill.
- Energy charges: increase of 46.33%, contributing 69.44% of total bill.
- – GCC makes up 0.94% of energy charges.
- – Legacy charge makes up 12.40% of energy charges.
- Other charges (service and admin, etc): decrease of 56.83%, contributing 2.26% of total bill.
Comparison of the two case studies
Despite the announced 12.75% increase announced by Eskom, one thing that is evident from both case studies is that farmers can expect an overall increase in electricity bills, that is much higher. Our clients have reported an increase in electricity bills ranging from 17%-25%.
In the case studies above, both sites, with and without a renewable system, saw a total increase of just over 23%. We will compare these results further below:
Actual financial savings with a renewable energy system is 54.94%.
- Electricity costs without renewable energy system: R3 042 031 for the year
- Electricity costs with renewable energy system: R1 370 830 for the year
- This amount does not yet account for exporting back to the grid.
- – This farm saved an average of R30 000 per month over the past 5 months (during their heaviest load season) due to grid export.
- – The additional savings increases total yearly savings to 66.77% for the year 2025/26.
Now the biggest question is: what changes did we make to ensure such high savings, despite the increase in electricity prices affecting both case studies equally?
- Closing of points/accounts that will not be necessary: this will lower administration and service charges.
- Solar energy generated and exported back to the grid: this lowers the reliance on energy from the grid and thus lowers the energy charges.
- Smart energy management: optimising grid use by taking into account time-of-use tariffs. This means we charge batteries during off-peak or standard times, to lower active energy charges.
Conclusion
The updated Ruraflex tariff structure brings about significant changes that affect all electricity users—whether they have a renewable energy system or not. While both case studies experienced similar overall increases in their Eskom bills, the farm with a renewable system achieved substantial savings through strategic changes: reducing points-of-delivery, exporting to the grid, and managing energy use more intelligently.
These results highlight a clear takeaway: renewable energy systems, when combined with smart planning and energy management, remain a powerful tool for reducing electricity costs—even in the face of rising tariffs. Farmers who proactively adapt to the new tariff structure can not only mitigate the impact of cost increases but also strengthen their long-term energy resilience.